
I'll never forget the 2 AM Slack ping that triggered the worst production incident at a company I contracted for. A payment transaction was failing intermittently (about 3% of the time), and nobody could figure out why.
We had logs scattered across eight different services, metrics showing everything was "green," and a monitoring dashboard that looked like a Christmas tree of false positives.
Some hours later, we finally traced the issue to a subtle timeout in our third-party fraud detection service that only triggered when specific upstream services responded slowly. The problem? We had no way to follow a single transaction through our entire stack.
That's the exact problem distributed tracing solves.
In this guide, I’ll walk you through how to implement distributed tracing the right way — from zero to measurable impact. Everything here comes from real production deployments, not conference talks or vendor white papers.
And look — if you're expecting this to solve all your problems overnight, I'll save you some time: it won't. Distributed tracing is infrastructure work. It takes planning, patience, and buy-in. But when you get it right? The next time you're hunting down that production bug at 2 AM, you'll finish in minutes instead of hours.
1. Get buy-in before you touch any code
Here's what usually kills observability projects: you spend months planning a beautiful tracing system, and then your VP asks, "What's the ROI?" and you freeze. I've watched talented engineers get their budgets slashed mid-project because they couldn't answer that question with actual dollars.
The most important work happens before you instrument a single service. You need to translate the technical problem into language that non-engineers actually care about.
Frame it in terms they already track
Forget talking about "span propagation" or "trace sampling" in your pitch deck. Your CFO or finance department doesn't really care.
What they do care about, let me show you some examples:
- P95 latency improvements: “We reduced our checkout P95 from 3.2s to 890ms, which increased conversion by 4.7%. Each 100ms of latency improvement = X dollars in quarterly revenue.”
- Mean Time to Resolution (MTTR): Before tracing, our average Severity-1 incident took 4.3 hours to resolve. After? 47 minutes. Calculate what those saved engineering hours are worth — it's usually more than four figures annually.
- Customer satisfaction: Our NPS improved 12 points once we fixed the long tail of slow requests. Track this monthly and tie it directly to system improvements.
The math is straightforward: downtime hours × hourly revenue.
When I pitched distributed tracing at my previous company, I calculated that reducing MTTR from 4 hours to 1 hour would save roughly $XM annually based on our incident history. That number got the budget approved.
Run a discovery workshop (seriously)
I know, meetings suck. But invest some hours upfront to define:
Clear owners: Who's actually responsible for implementation? For maintenance? For training teams? Write. It. Down.
Budget constraints: What can you actually spend? Include both tooling costs AND engineering time. I usually estimate 40% more time than the initial guess because nobody accounts for the "oh shit, we need to refactor our auth layer" moments.
Success metrics: Pick ONE north star KPI that everyone agrees on. Not five, not three — one. For us, it was "reduce P95 checkout latency below 1 second." Simple. Measurable. Everyone understood it.
Timeline: Be realistic. A proper distributed tracing rollout takes 2-4 months for a medium-sized org (30-100 services). Anyone who tells you it's a "quick weekend project" has never done it at scale.
Here's my pre-flight checklist before starting any observability work:
□ Can I explain the business value in 30 seconds?
□ Do I have a specific dollar amount or KPI improvement target?
□ Does my manager's manager understand why this matters?
□ Do I have dedicated engineering time (not "when you have a spare moment")?
□ Have I identified the 3-5 most critical services to instrument first?
If you can't check all five boxes, stop. Fix those gaps first. I've never seen a successful observability project that skipped this step.
2. Pick your stack and understand the trade-offs
Tool fatigue is real. Last time I counted, over 25 different observability vendors were pitching their "complete solution." Every conference talk shows beautiful dashboards that work perfectly in demos but mysteriously break in production.
Here's the reality: you're choosing between two fundamentally different philosophies, and this choice will shape your next years.
The DIY path: maximum control, maximum headaches
Go with OpenTelemetry Collector + Jaeger, Tempo, or Zipkin if you:
- Have strong ops/SRE capacity
- Need complete data sovereignty (regulated industry, security paranoia, whatever)
- Want to avoid vendor lock-in at all costs
- Can stomach being on-call for your monitoring infrastructure
I ran an open-source tracing stack at my last company.
The positives: we controlled everything, costs were predictable, and we customized it exactly how we wanted.
The negatives: I spent ~20% of my time maintaining the infrastructure instead of improving observability. Storage costs scaled linearly with our traffic (surprise!), and upgrading Jaeger meant scheduling maintenance windows.
Here’s what the real cost breakdown looks like from my experience:
- Initial setup: ~3 weeks of dedicated engineering time
- Ongoing maintenance: ~1 day per week
- Incident response for the tracing system itself: ~5 hours/month
That last point is brutal. Nothing worse than your monitoring system going down during an actual incident.
The managed path: pay to make problems go away
Go with Datadog APM, New Relic One, or AWS X-Ray if you:
- Value engineering velocity over cost optimization
- Want to instrument fast and iterate
- Don't have a dedicated SRE headcount
- Prefer paying monthly bills over architecting storage clusters
I've used Datadog at two companies.
The positives: we instrumented 30 services in a week, auto-discovery worked great, and support actually responded within hours.
The negatives: our bill grew faster than our traffic (they charge on spans AND custom metrics), and migrating away looked expensive enough that we just... didn't.
Open-source vs. managed
When choosing between open-source and managed, here's what matters:
Choose open-source if:
- You're already running Prometheus/Grafana and like that workflow
- Your company has "no vendor SaaS" policies
- You have <50 services (setup scales with complexity, not just size)
- Someone on your team actually enjoys infrastructure work
Choose managed if:
- You're in growth mode and shipping features > optimizing costs
- Your monitoring "strategy" is currently grep + prayer
- You need to show results in 30 days, not 3 months
- Nobody wants to debug Cassandra at 3 AM
Regardless of choice, make this non-negotiable: use OpenTelemetry exporters for all instrumentation.
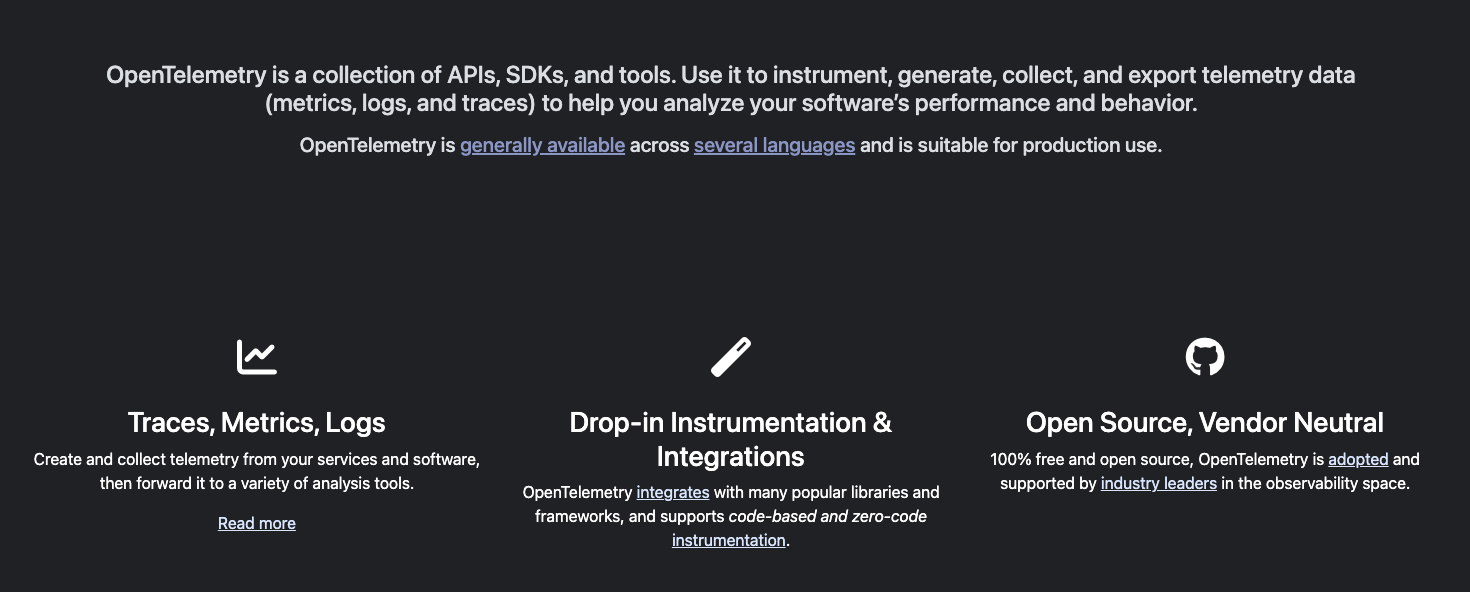
I learned this the hard way. At a previous company, we went all-in on a vendor's proprietary SDK. Two years later, when we wanted to switch (because pricing got ridiculous), we had to rewrite instrumentation code across 60+ services. It took us 8 months and cost more than just staying with the vendor would have.
OpenTelemetry is your insurance policy. Instrument once with OTel, and you can swap backends later by changing config files, not code. Yes, you'll lose some vendor-specific features. No, you won't lose the ability to change your mind.
The hidden cost: organizational complexity
Last thing nobody mentions: the more tools you run, the more "sources of truth" you create. I've watched engineers waste minutes arguing whether Datadog or internal metrics were "correct" because they showed different numbers.
Pick one system for traces. One system for metrics. One system for logs. Make them talk to each other. But for the love of all that is holy, don't run multiple competing observability stacks. Your future on-call engineers will thank you.
3. Instrument services (without killing performance)
The worst instrumentation mistake I ever made? Adding spans to every single database query in our ORM. Seemed like a good idea — granular visibility, right? Wrong. Our API latency jumped 40ms across the board. Turns out, creating and recording 200 spans per request has overhead. Who knew?
Here's what I've learned after instrumenting hundreds of services: start lean, add strategically.
The instrumentation priority list (based on pain, not completeness)
Forget instrumenting alphabetically or by service size.
Instrument based on where you're currently blind:
1. HTTP servers (your entry points): These are non-negotiable. Every request that hits your system needs a root span. This is your "transaction started here" marker. Without it, everything downstream is orphaned data.
2. Database clients (where slowness hides): Not every query, just the connection pool and transaction boundaries.
I instrument:
- Connection acquisition time (catches pool exhaustion)
- Transaction start/commit/rollback
- Slow query threshold crossings (>100ms for us)
This gives you 80% of the value with 20% of the overhead.
3. Message brokers (the silent killers): Queue systems are where traces go to die if you're not careful. The trick: propagate context through message headers. I've debugged so many "mysterious delays" that were just messages sitting in a dead letter queue for hours because nobody was tracing async workflows.
4. Background jobs (the forgotten children): These fail all the time silently. Instrument them, but be smart about it. A job that runs every 5 minutes doesn't need 100% sampling. Sample at 1% and still catch problems.
The one test that matters
Before you instrument anything else, verify this works:
# Send a request with a trace ID
curl -H "traceparent: 00-4bf92f3577b34da6a3ce929d0e0e4736-00f067aa0ba902b7-01" \
https://your-api.com/health
# Check your tracing backend
# Search for trace ID: 4bf92f3577b34da6a3ce929d0e0e4736
If that trace shows up with a single root span? You're good. If it shows up as disconnected fragments? Your context propagation is broken. Fix that before instrumenting anything else.
The "just instrument everything" trap
I see this pattern constantly: an engineer gets excited about tracing, instruments every function call, deploys to production, and suddenly P95 latency is up 150ms.
Here's what I instrument:
- Service boundaries (HTTP, gRPC, message queues)
- External calls (databases, third-party APIs, caches)
- Critical business logic (payment processing, auth checks)
- Known problem areas (anything that's been slow before)
What I don't instrument:
- Pure functions with no I/O
- Internal helper methods
- Loops (unless they're doing I/O)
- Anything that runs more than 10 times per request
The goal isn't to trace everything. The goal is to trace enough to understand what's slow and why.
4. Use the data (visualization and alerts)
Collecting data is easy. Using it effectively? That's where most teams fail. I've walked into companies with beautiful tracing infrastructure that nobody touched because the dashboards were unusable and the alerts fired constantly.
Here's how to avoid building observability theater.
Make visualization obvious
The goal isn't to build comprehensive dashboards. The goal is to make problems obvious at a glance.
Your primary debugging tool: Flame graphs.
Here’s what it looks like:
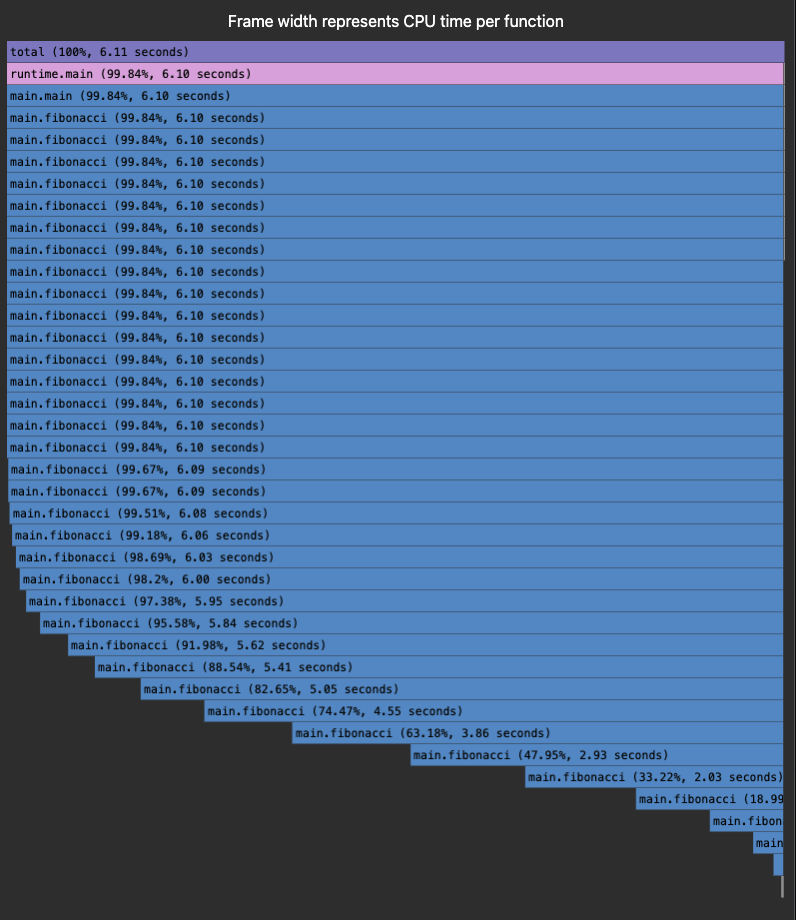
These horizontal bar charts show you exactly where time is spent.
I can glance at a flame graph and immediately see:
- Which service is slow (widest bars)
- Which function is the bottleneck (longest bars)
- Unexpected dependencies (weird call patterns)
Here's a real example: We had checkout taking 3.2 seconds. The flame graph showed our inventory service making 47 sequential database calls. We batched them into 2 calls, reducing latency to 840ms. Flame graphs made it obvious in 30 seconds.
Alerts: signal vs. noise
Bad alerts train your team to ignore alerts. I've seen on-call engineers with 25+ Slack notifications because every minor blip triggered an alert. They just stopped reading them.
Here's my alert philosophy, alert on user impact, not metrics:
- Bad alert: "Trace processing latency above 100ms"
- Good alert: "API P95 latency above SLO (>1s) for 5 minutes"
The difference? The second one means users are actually experiencing slowness. The first might just be a transient spike that nobody noticed.
The Weekly Review Ritual
Don't wait for alerts to improve your system. Schedule a recurring 1-hour session:
- Review the slowest traces from the past week: Pull up the top 20 slowest successful requests. Not errors — successes. These are the ones quietly degrading user experience.
- Group by pattern: Are they all hitting the same service? Same endpoint? Same time of day? Find the common thread.
- Fix the top issue: Pick ONE thing to optimize. Ship it. Measure the improvement.
- Repeat next week: Make this a habit. Small, consistent improvements compound.
I've run this ritual at different companies. It's consistently delivered the most ROI per hour invested.
In short, distributed tracing isn't magic. It's infrastructure work that requires planning, discipline, and consistent effort. But when you get it right, you transform your organization's ability to understand and improve complex systems.
Start small. Instrument your most critical services first. Get buy-in by showing quick wins. Build momentum. Scale systematically.
And remember: the goal isn't perfect observability. The goal is better observability than you had yesterday. Progress, not perfection.
Contribute to AGI development at DataAnnotation
The systems thinking that helps you build production systems is the same thinking that shapes frontier AI models. At DataAnnotation, we operate one of the world's largest AI training marketplaces, connecting exceptional thinkers with the critical work of teaching models to reason rather than memorize.
If your background includes technical expertise, domain knowledge, or the critical thinking to evaluate complex trade-offs, AI training at DataAnnotation positions you at the frontier of AGI development.
Our coding projects start at $40+ per hour, with compensation reflecting the judgment required. Your evaluation judgments on code quality, algorithmic elegance, and edge case handling directly influence whether training runs advance model reasoning or optimize for the wrong objectives.
Over 100,000 remote workers have contributed to this infrastructure.
If you want in, getting from interested to earning takes five straightforward steps:
- Visit the DataAnnotation application page and click "Apply"
- Fill out the brief form with your background and availability
- Complete the Starter Assessment, which tests your critical thinking and coding skills
- Check your inbox for the approval decision (typically within a few days)
- Log in to your dashboard, choose your first project, and start earning
No signup fees. DataAnnotation stays selective to maintain quality standards. You can only take the Starter Assessment once, so read the instructions carefully and review before submitting.
Apply to DataAnnotation if you understand why quality beats volume in advancing frontier AI — and you have the expertise to contribute.
.jpeg)